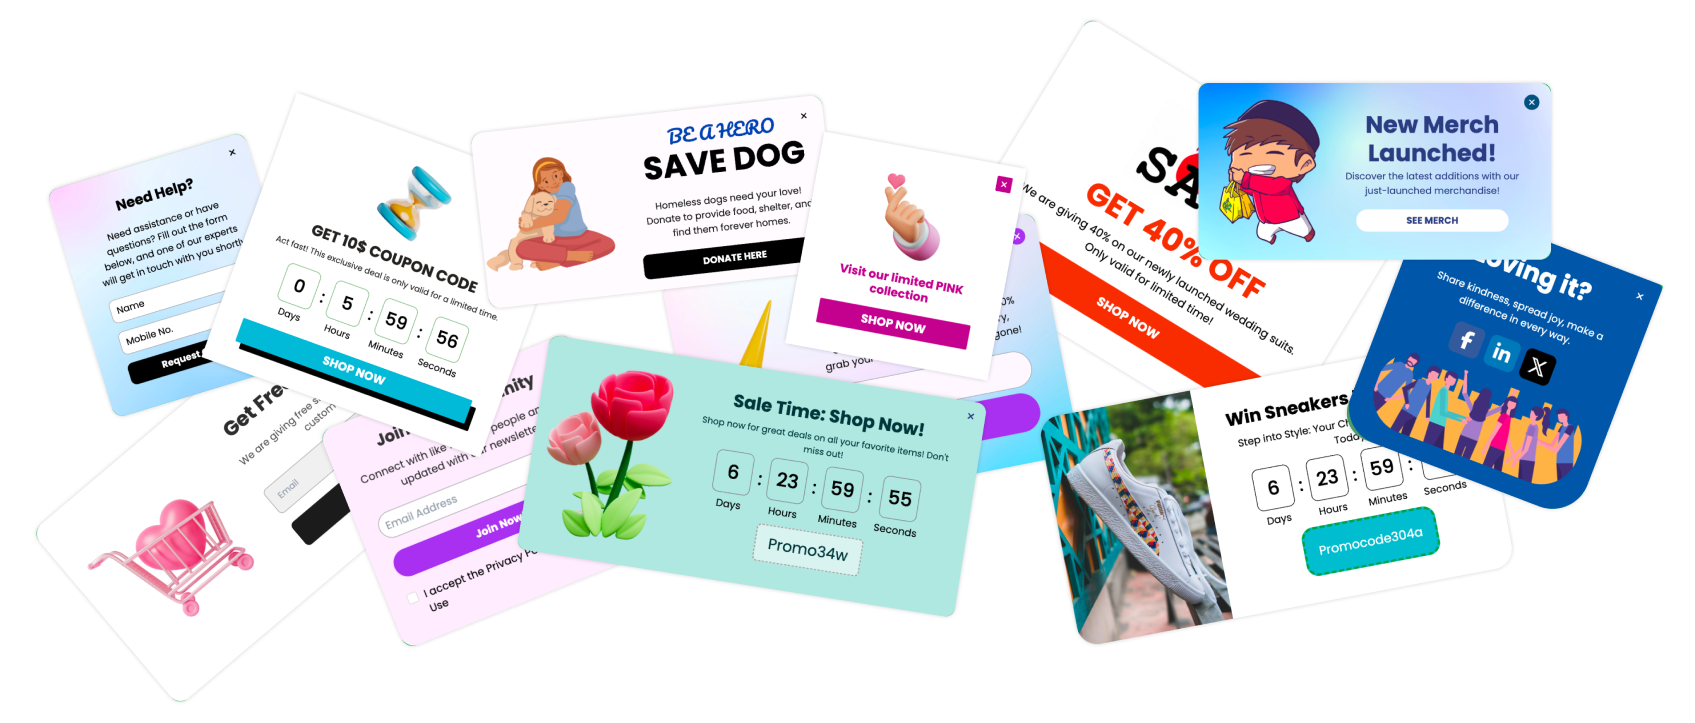

Your pop-up is live. The form works. The button is right there. And visitors are closing it with the speed and confidence of people who have done this a thousand times before.
Back to the editor you go.
Perhaps a product image would help. Perhaps visitors need a discount. Or perhaps you’ve spent twenty minutes moving the button three pixels to the left, and it’s time to try something more useful.

When a campaign gets fewer responses than expected, choosing the next change can be difficult. There are plenty of features you could add, but each one should have a reason to be there.
As the founder of Poper, I wanted to understand how some of those choices compared across our customers’ campaigns. We researched customer pop-up campaign data from the previous 365 days, looking at campaigns with and without images, and campaigns with and without discounts.
The image comparison showed a substantial difference in recorded conversion rates. The discount comparison showed a smaller one.
Here’s what we found, what I would test, and where to add these features in Poper.
Our Pop-Up Research at a Glance

The research covered approximately 5,300 domains and 15,700 campaigns.
A conversion here means a recorded campaign conversion event. The action depends on the campaign, so these figures should not automatically be read as purchases.
We compared existing campaigns with different audiences, offers, designs, and display settings. The results show observed differences between groups, rather than proving that one feature caused better performance.
The original analysis also acknowledged possible bias and incomplete cleaning. We have excluded its potentially biased top-decile figure.
I would use these findings to choose a test, then let the campaign’s own results guide the decision.
A Glance at Display Volume by Industry
The research included campaigns across several website categories. SaaS contributed the largest display volume shown in the industry chart, followed by ecommerce outside the separately identified Shopify category.
| Website category | Displays |
|---|---|
| SaaS | 29.9 million |
| Ecommerce: Other | 18.1 million |
| Local businesses | 15.5 million |
| Other categories | 15.3 million |
| Healthcare | 10.5 million |
| Blogs and content | 10.4 million |
| Nonprofits | 10.1 million |
| Agencies | 9.7 million |
These selected categories account for approximately 119.5 million displays, about 89% of the overall total. Other categories included finance, education, real estate, and coaching and consulting.
These are display counts, not website counts or unique visitors.
The variety matters. A visitor browsing products has a different decision to make from someone reading an article or exploring a software service. The combined findings give us a broad comparison, but the research does not show how images or discounts performed separately within each industry.

With Images vs. Without Images
Should you include an image in your pop-up?
Across the campaigns we researched, the group with images recorded a higher conversion rate.
| Campaign group | Campaigns | Displays | Conversion rate |
|---|---|---|---|
| With images | 8,860 | 85.1 million | 2.76% |
| Without images | 4,230 | 48.6 million | 1.00% |
Campaigns with images recorded 2.76% CVR, compared with 1.00% for campaigns without images.
That is a difference of 1.76 percentage points, or 2.76 times the recorded conversion rate.
Both groups had substantial exposure. This makes relevant imagery a worthwhile test, although adding an image to an existing campaign will not necessarily reproduce that difference.
The research did not separate product photography, illustrations, resource previews, or other image types. It also did not isolate image use from the campaigns’ other differences.
Give the image something useful to do
My first question would be whether the visual helps someone understand the offer.
For example, a downloadable guide could have a cover preview. A product promotion could show the product being offered. These are illustrative ideas, rather than specific image types whose performance was established by the research.
The connection should be obvious. Visitors should be able to glance at the image and understand how it relates to the headline.
Avoid choosing a picture simply because the layout looks empty. Empty space does not always need rescuing.

Leave room for the action
Once you add the image, look at the entire pop-up.
Can visitors still read the headline comfortably? Are the input fields and button easy to use? Does the mobile version communicate the offer without feeling crowded?
The visual should support the decision you want someone to make. If it pushes the important information out of view, adjust the design.
A pop-up without an image can still be a sensible choice for a straightforward invitation. The no-image group recorded conversions across 48.6 million displays, so the finding gives us a reason to experiment rather than a rule every campaign must follow.
With Discounts vs. Without Discounts
Discounts give visitors a concrete incentive, particularly when they are considering a purchase. But how did campaigns with discounts compare with those without them?
| Campaign group | Campaigns | Displays | Conversion rate |
|---|---|---|---|
| With discount | 2,920 | 4.3 million | 2.36% |
| Without discount | 10,170 | 129.5 million | 2.11% |
Campaigns with discounts recorded 2.36% CVR, compared with 2.11% for campaigns without discounts.
The difference was 0.25 percentage points, approximately 12% higher in relative terms.
The exposure was uneven, with far more displays in the group without discounts. The observed gap was also smaller than the image comparison.
For me, this makes discounts an option to evaluate carefully. It does not establish that a pop-up needs a discount to get responses.
Match the incentive to the visit
A purchase discount may fit someone browsing an online store. Another visitor may be more interested in a useful resource, product updates, or early access to a launch.
Those are possible alternatives to test. Their individual performance was not measured in this comparison.
Think about why the visitor is on the page and what would make your invitation worthwhile. A relevant offer gives you a clearer starting point than adding a discount by default.
Explain what visitors will receive
If you offer a discount, make the promise specific and accurate.
Explain relevant conditions, such as whether it applies to a first order, selected products, or a minimum purchase. Keep those details readable.
The same principle applies without a discount. Tell visitors what they will receive and why it is useful. A vague incentive can leave someone unsure whether responding is worth the effort.
Check what happens after the conversion
The research chart compares recorded campaign conversions. It does not show whether discount campaigns generated more revenue or profit.
For an ecommerce campaign, you would also want to examine purchases, discount use, and margin. More signups may be valuable, but they do not answer every business question.

Choose the outcome you care about before deciding which offer performed better.
How to Add These Features in Poper
Once you have chosen a feature to test, you can start in the pop-up editor.
Add an Image to Your Pop-Up
Open the Add tab in the left panel. Under Media, select Image to add an image element to your design.

Use a visual that relates directly to the offer, then review how it sits alongside the headline, form, and button.
For your comparison, keep the offer and copy consistent between the version with an image and the version without one. That will make the result easier to interpret.
Add a Coupon for Your Discount Offer
In the Add tab, find the Shop section and select Coupon to add a coupon element to your pop-up.

Use the surrounding copy to explain the discount and its relevant conditions. Make sure the displayed offer matches what visitors can redeem in your store.
Choose the incentive before designing the campaign. That helps keep the headline, coupon, and call to action focused on the same promise.
Add Another Step to Your Pop-Up
To add another step, use the + button beside the Main tab at the top of the editor.

Plan what each step should accomplish before expanding the flow. An illustrative sequence might introduce the offer first and collect the necessary information afterward.
Our research recorded higher CVR for multi-step campaigns, but we discuss that comparison in “Single vs. Multi-step Pop-ups.” When testing images or discounts, keep the flow consistent so you can focus on the feature being compared.

Find What Makes Your Offer Click
Add an image that brings your offer to life or try a discount that fits your audience. Use Poper’s A/B testing to compare variations and see which version gets more responses from your visitors.
Create Your Pop-Up Test one change at a time and preview your design on desktop and mobile.A/B Test Your Pop-Ups to Find What Works for Your Audience
Once you have created two versions of your pop-up, you can use Poper’s A/B testing feature to compare their performance. Here’s how to set up a test.
Step 1: Create an A/B Test
In your Poper dashboard, find the folder containing the two pop-ups you want to compare. Click the three-dot menu next to the folder, then select Create A/B Test.

Step 2: Configure Your Test
A window will appear where you can name your test, add an optional description, and select the pop-ups you want to compare.
Choose the first pop-up as the Control and the second as the Variant. The control is your baseline, while the variant is the version you want to test against it.
For example, if you want to compare a pop-up without an image or discount against one that includes both features, select the version without them as the control and the version with them as the variant.

Step 3: Set Your Traffic Allocation
Choose how you want to distribute traffic between the two versions. For an initial comparison, a 50/50 split is a straightforward option because both versions receive an equal share of the test traffic.
You can adjust the percentages to suit your testing requirements, but make sure the allocation is appropriate for the comparison you want to run.
Step 4: Create Your Test
Once you have selected both pop-ups, assigned the Control and Variant labels, and configured the traffic allocation, click Create Test to set up your A/B test.
After the test runs, compare the results to see which version performs better against your chosen conversion goal. Give the test enough traffic and time to collect meaningful data before deciding which version to keep.
Give Each Feature a Reason to Be There
The image comparison gives me a strong reason to test a relevant visual. The discount comparison encourages a more considered look at the incentive and the value of the resulting action.
Start with the change that could make your offer clearer or more appealing. Keep the comparison focused, and judge success using the completed action that matters to your campaign.
You can build your pop-up in Poper, add the features that suit your offer, and test how your audience responds.